- Documentation
- 1 - Start Here
- 2 - Indicators
- 2.1 Future Pivots
- 2.2 - WaveTrend
- 3 - Tools

🌟 Introduction to the Future Pivots Indicator
The Future Pivots indicator is a powerful tool designed to help traders identify potential points of significant market movement. Unlike traditional indicators, FP focuses on the timing of these movements rather than their direction. This guide will delve into the functionalities, settings, and integration of FP to ensure traders of all experience levels can effectively utilize this tool.
✨ What Future Pivots Does
- Timing Over Direction: FP excels in signaling when significant market moves are likely to occur. This allows traders to prepare and use other indicators to determine the potential direction of these moves.
- Compatibility: It's designed to work seamlessly with various trading systems, including the Lorentzian Classification, enhancing analysis by providing a strong source of timing confluence.
🌀 Price-Time Warping
- Concept Clarification: Price-Time warping refers to periods where the market experiences abnormal movements, making traditional analysis challenging. FP identifies these warps, offering traders insights into potential volatility.
- Complementing Lorentzian Classification: While Lorentzian Classification excels within warped spaces by comparing data points favorably, FP identifies the warping itself, making them complementary tools.
At first glance, Future Pivots resembles a truncated oscillator that stopped halfway through history and gives you a really weird projection as to the direction of price action. The critical thing to understand is that it's not predicting the direction and that this indicator itself is pretty unique in that you can pair it with almost any system you can think of, whether it's Lorentzian classification, Deep forecast, maybe a system that you've invented or one you're using from another developer. It really doesn't matter because the quality of the information and the type of information that you're getting from this indicator will pair extremely well and can almost always improve your analysis.
In the scenario below, we're looking at Points in the future that could serve as the sort of warping that you would encounter in price time, and that would ultimately result in either a strong continuation or a complete reversal.
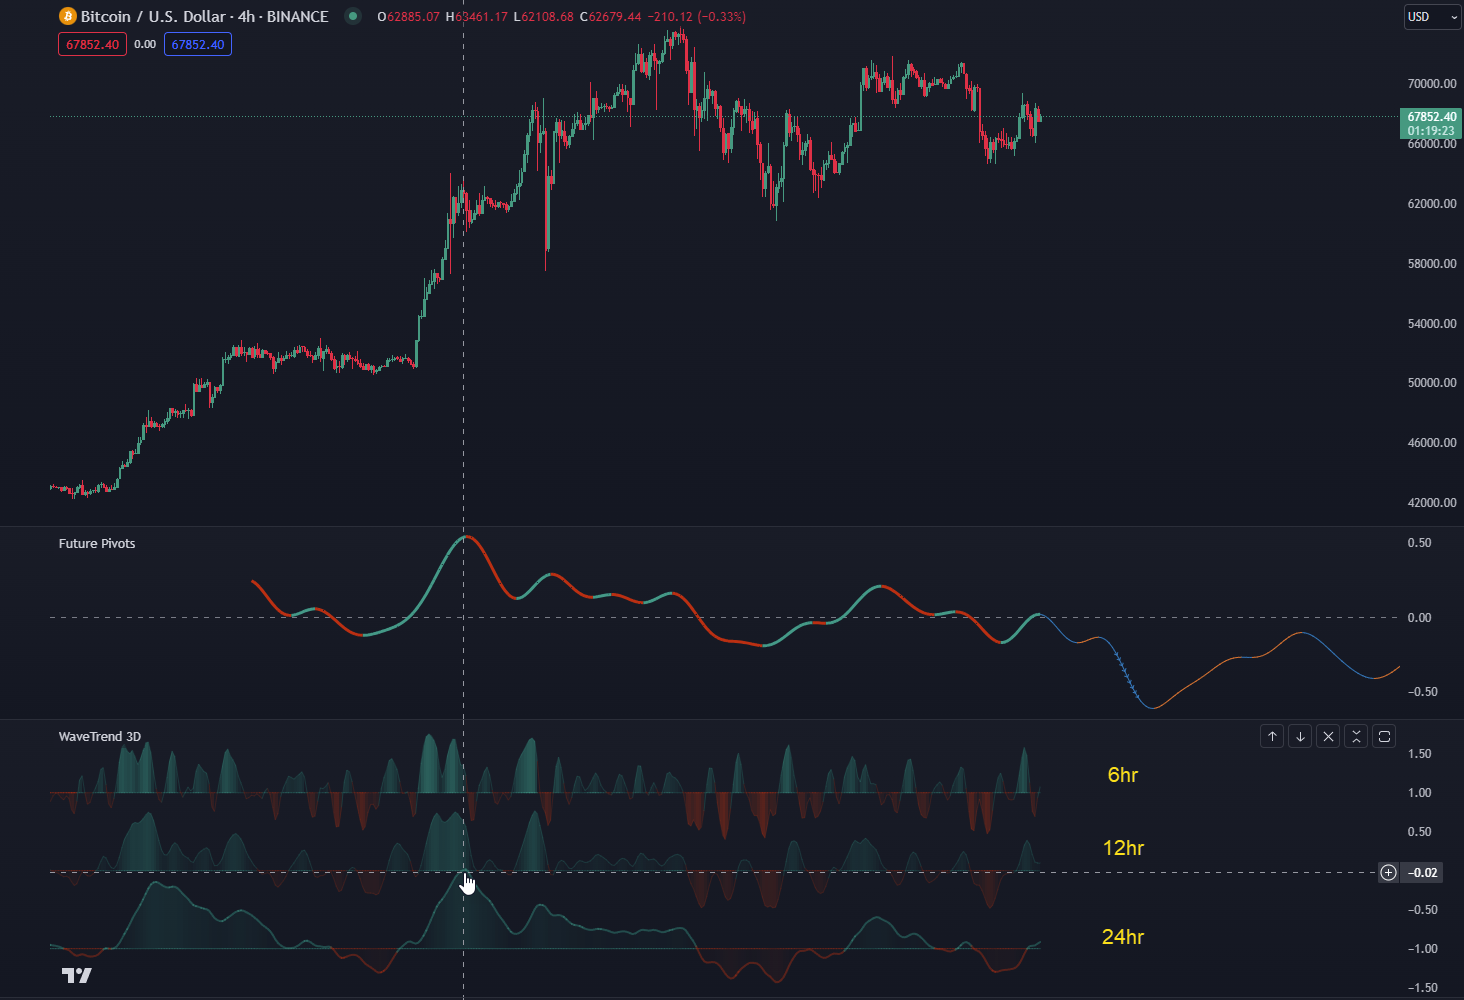
This particular case, one thing I want to point out is that we are on the 12 hour chart for Bitcoin, but if you look closely at the trusty Wavetrend3D down here, the top oscillator is 6hrs, the middle oscillator is 12 hours, and of course the bottom oscillator represents 24 hours.
If you look closely at the green and the red portion, you will notice that closely resembles this slow oscillator down here, and that's actually very intentional. The same signal extraction, isolation, and smoothing process that WaveTrend 3D uses including the whole inverse Fisher transform, the hyperbolic tangent function, the normalization aspect, all of that serves as a great front runner into isolating a very dominant frequency for any given chart, which is essentially twice the chart itself. So, in this case, it's a full day that we're looking at. It's a really great way to focus in on the pivots that truly matter the most.
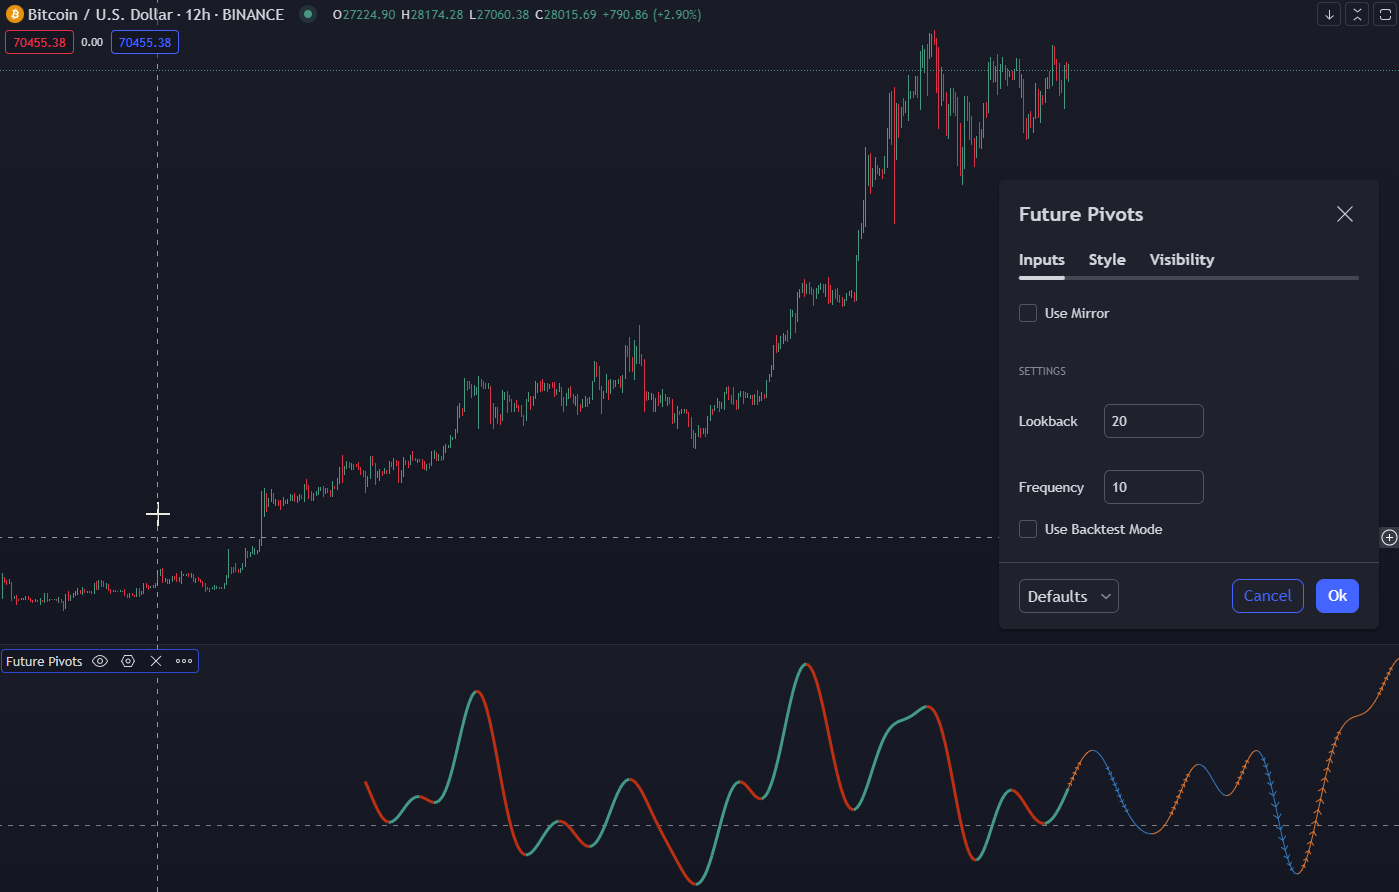
⚙️ Settings and Customization
In terms of the actual settings, I'd recommend just keeping them as is for the most part. Very rarely will you run into scenarios that it might actually be helpful to do some tweaking of your own.
The harmonics of WaveTrend 3D are really quite beautiful. A lot of times you can will see patterns extremely clearly like this inverse head and shoulders pattern in the screenshot below. Whenever you have the final color change it almost always coincides with a very significant break to the upside or even a reversal.
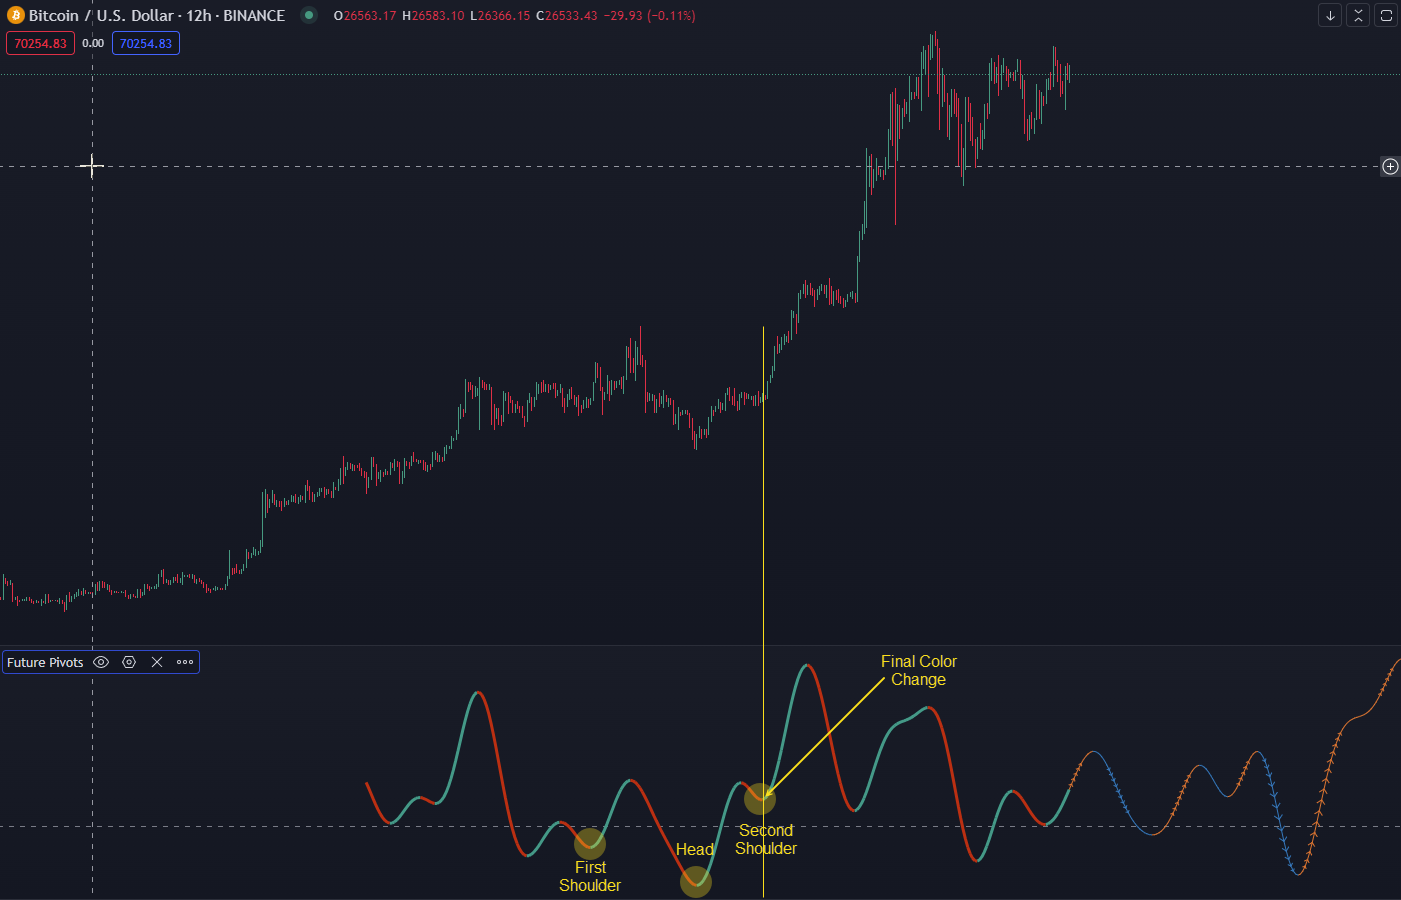
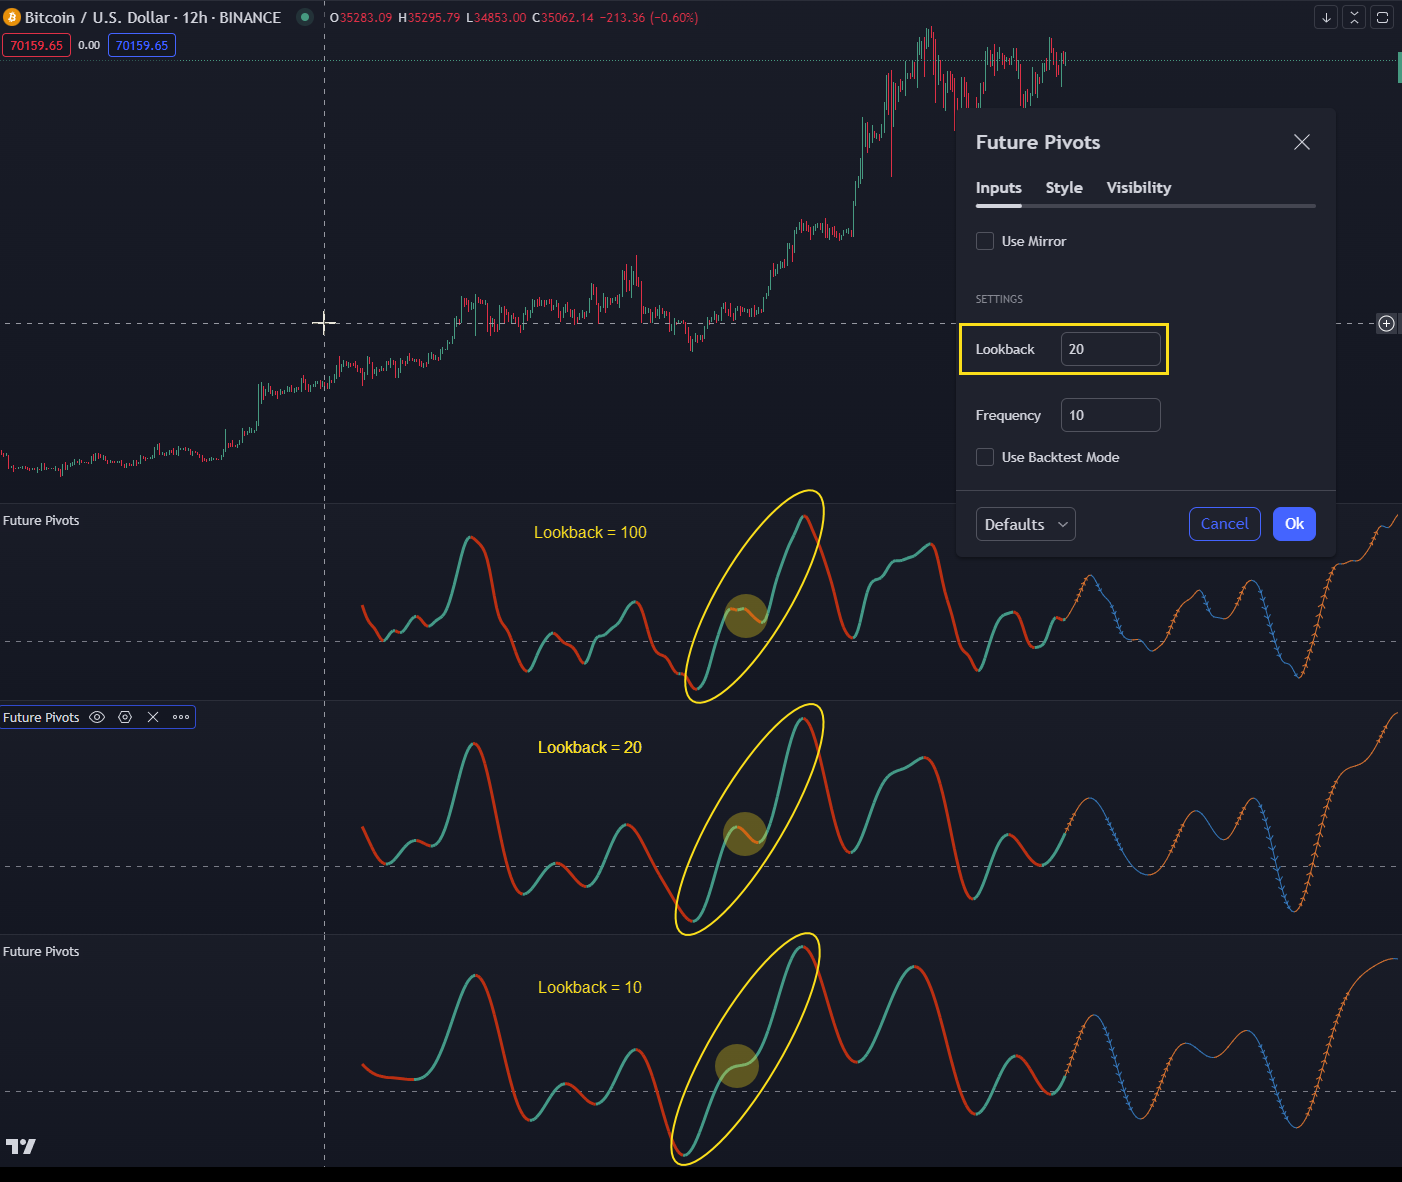
So what you can do if you don't want to see that is you can lower the lookback, which is more of a granularity setting and it will a heavier level of smoothing so that you can pretty much cruise all the way up to the point where it moves into a ranging pattern. It essentially removes the potentially noisy ups and downs in these periods of ranging markets, as opposed to a more trending regime.
On the flipside to this, if you change the lookback to 100, you'll get something that very closely resembles Wavetrend 3D.
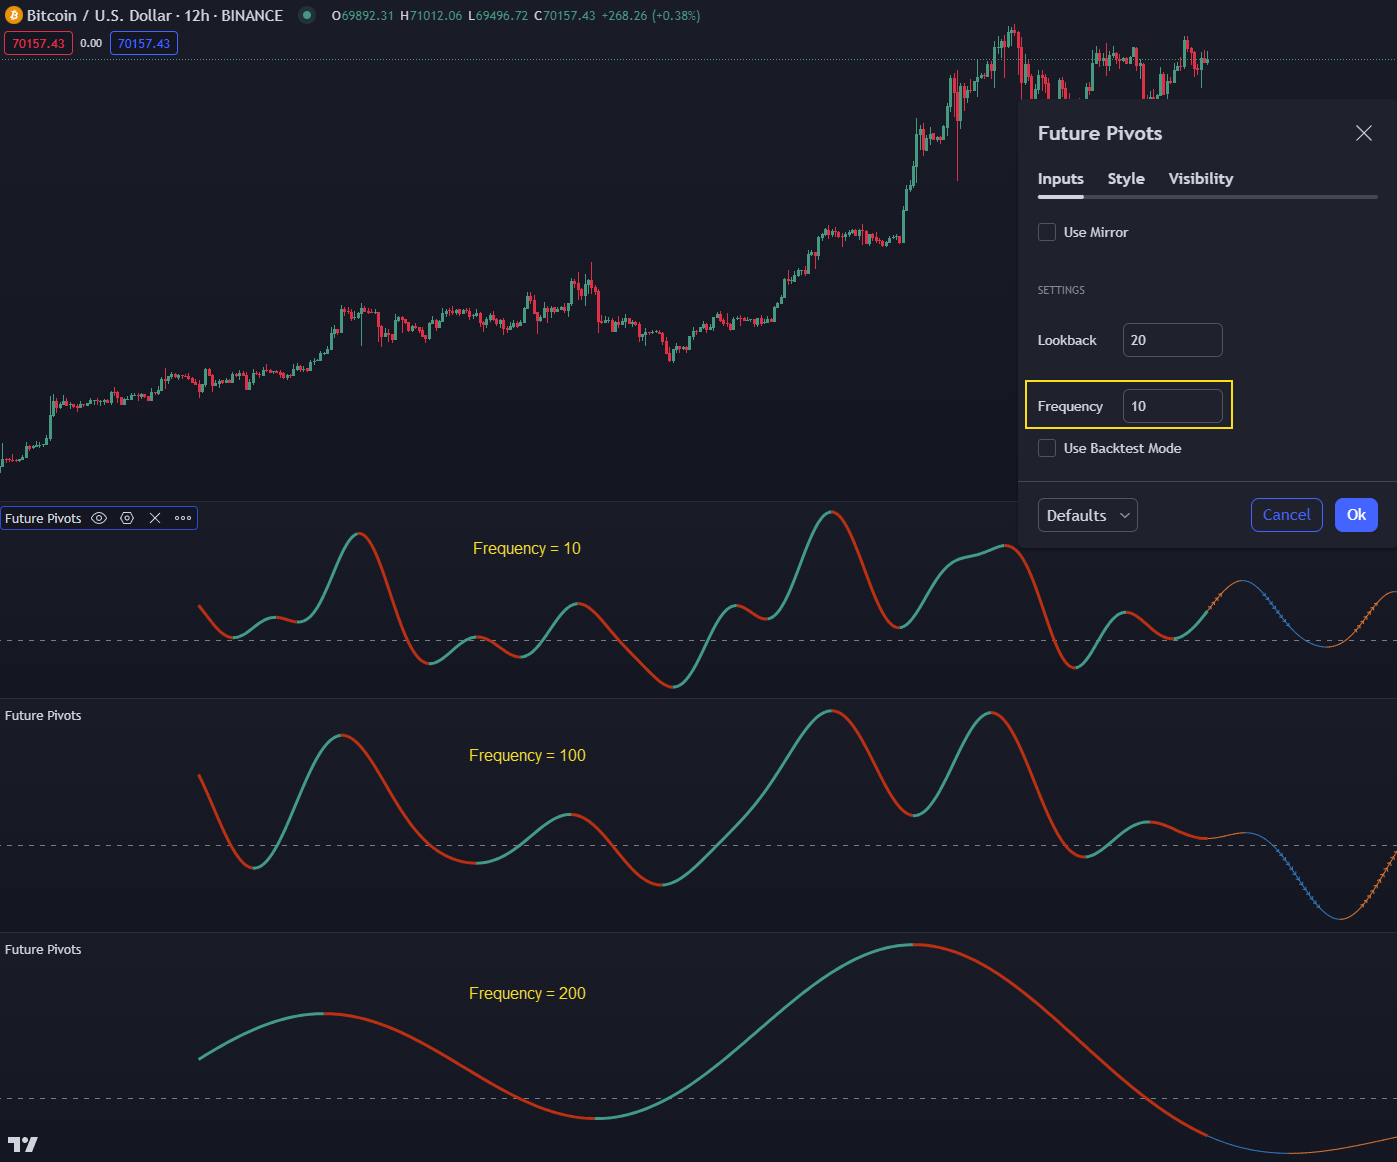
The frequency setting is very similar to changing the time frame itself. If you move it up or down, it will change the frequency in such a way that it may slightly shift some of the pivots and highlight others that maybe weren't as obvious on another frequency but for the most part, I really liked the frequency of 10 as a default.
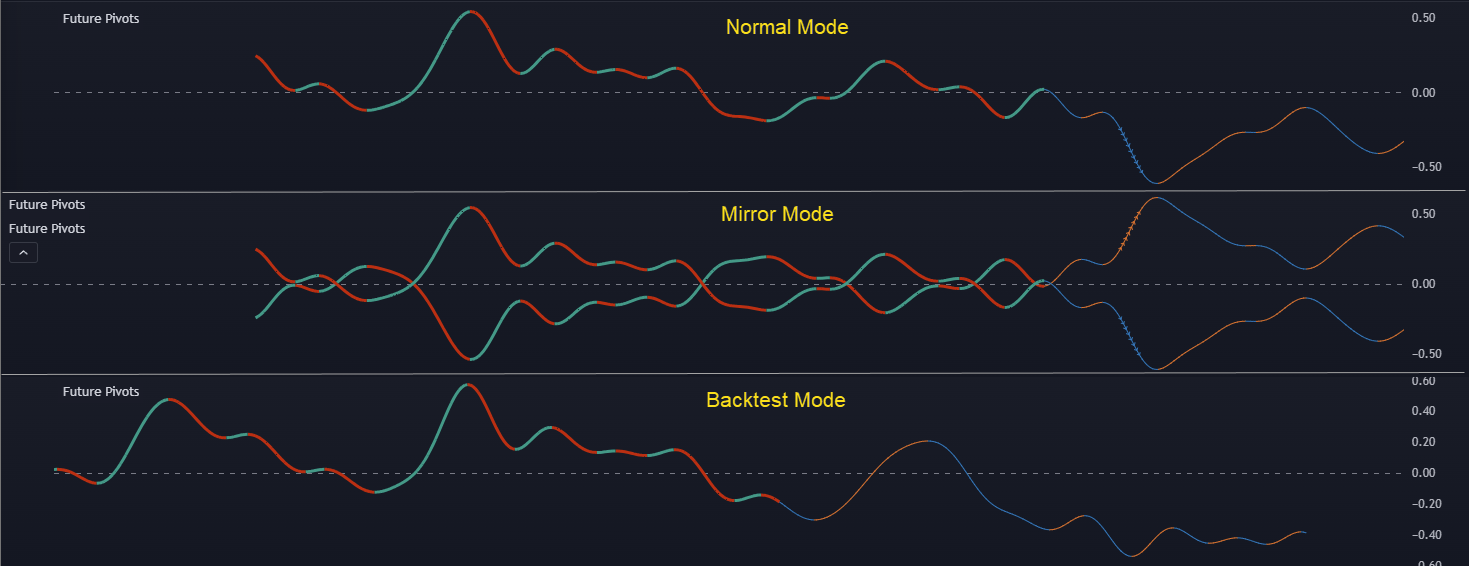
🔙 Backtest Mode
The backtest mode allows traders to visually verify the effectiveness of FP's settings against historical data. This feature is crucial for understanding how well the indicator predicts future volatility.
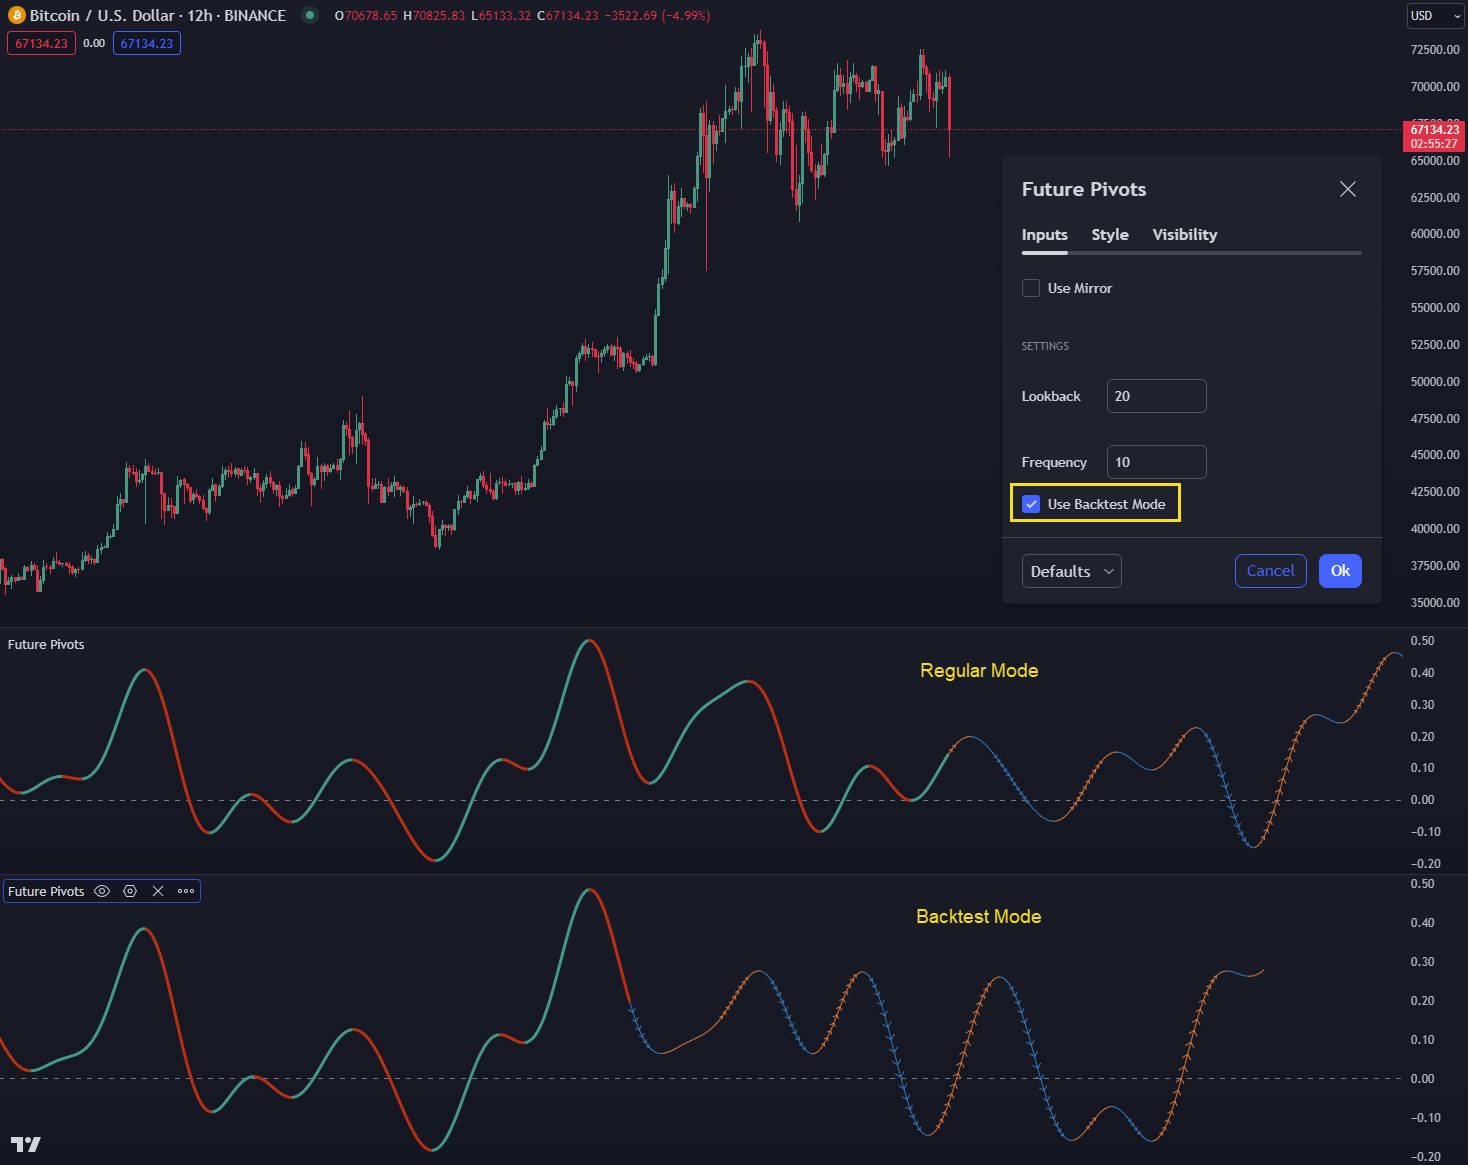
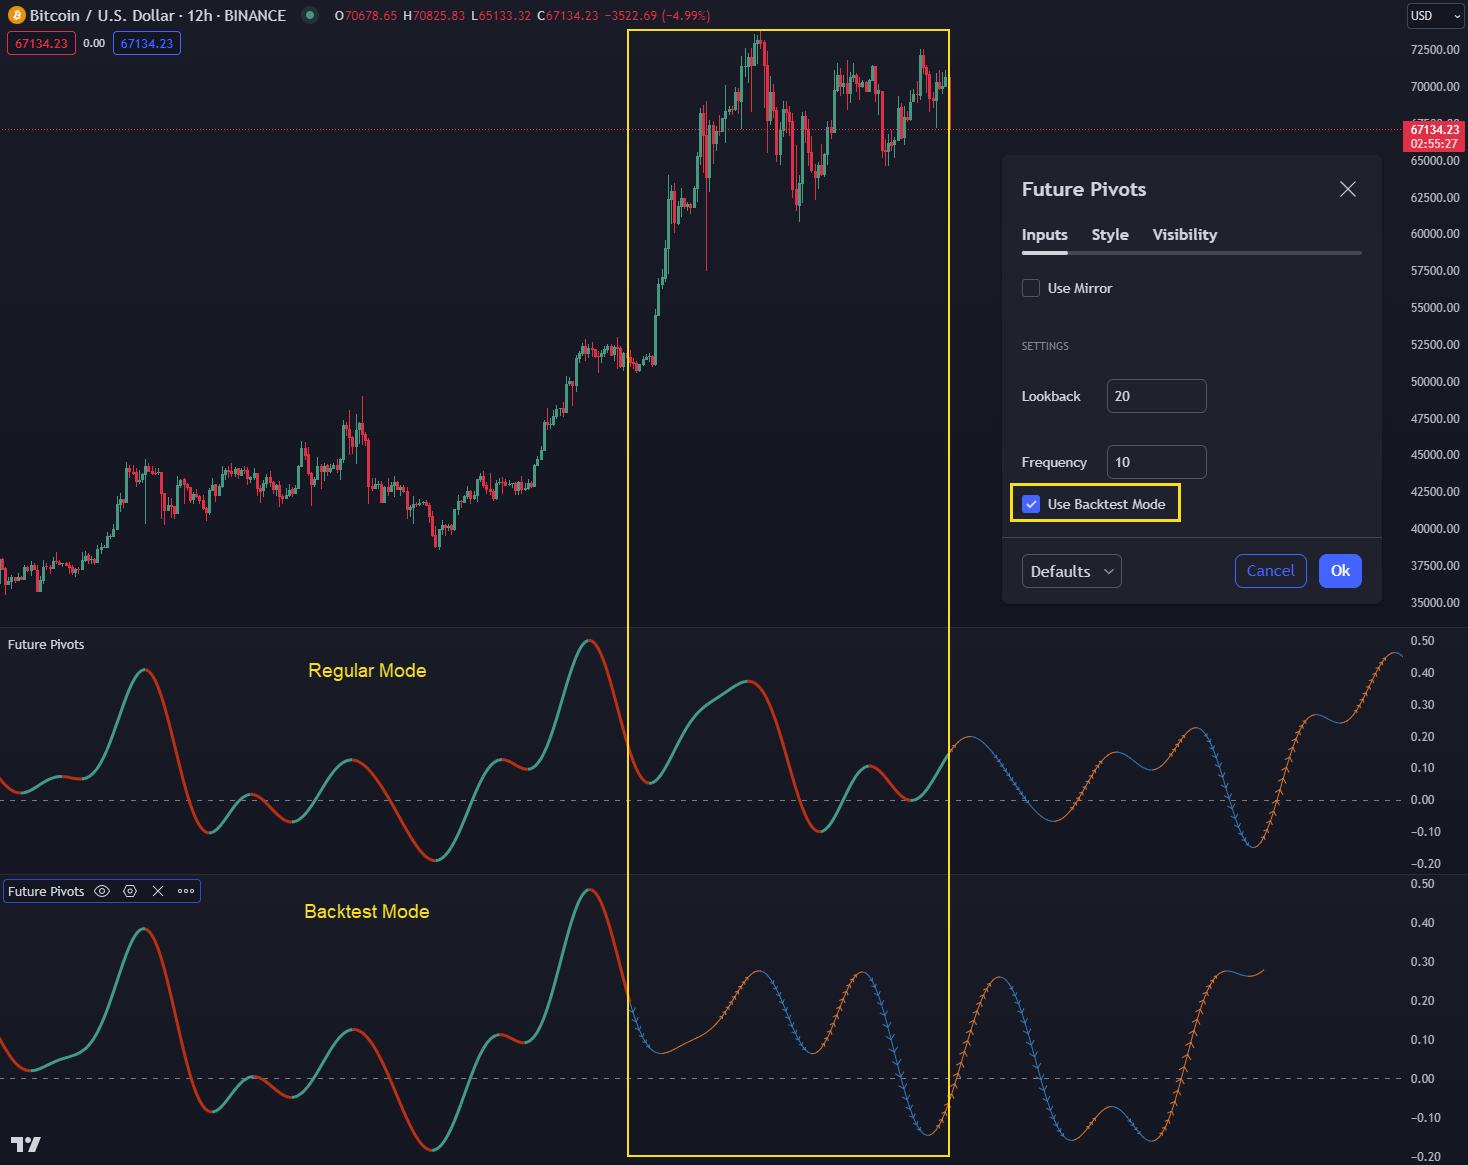
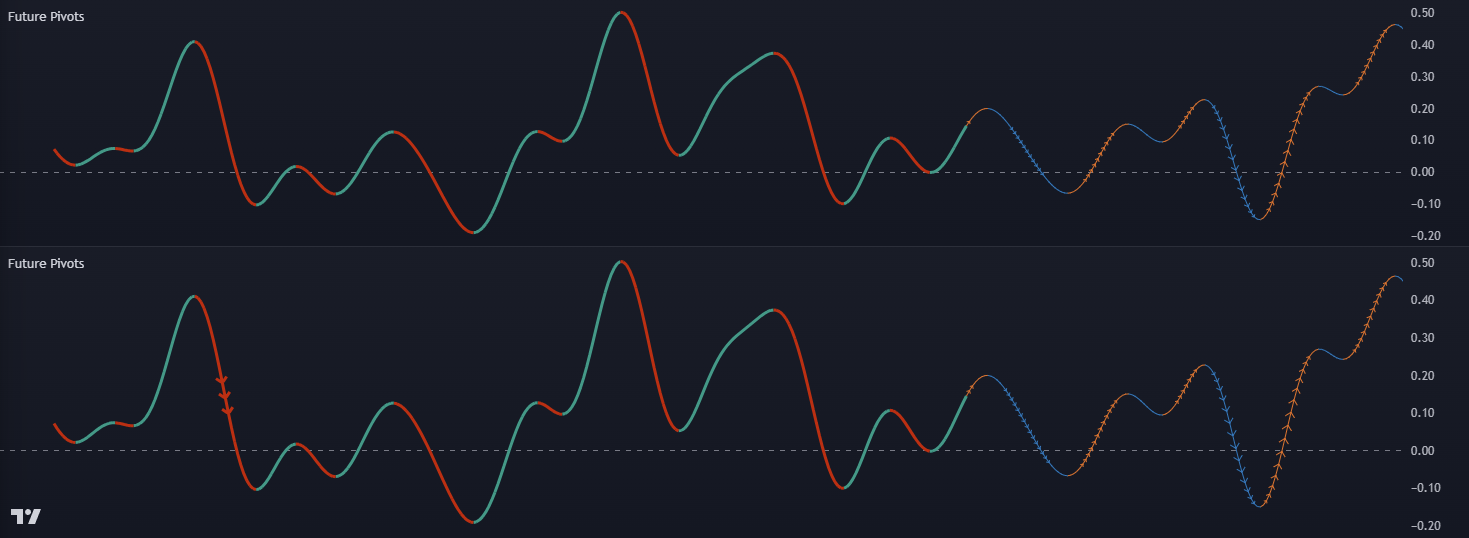
It's more of a visual verification that whatever settings you're ultimately dialing in are having an effect that is more or less consistent with pivots that you are observing. It reserves this last chunk of historical bars (as seen below) for evaluation purposes, sort of like a validation set in machine learning.
What you're looking specifically is color changes, either that or instances where it crosses the median. Anytime it crosses the median or experiences a color change from orange to blue in the projection side, that is of high interest because that means on the one day timeframe, there's likely going to be a period In the future where there's going to be increased volatility.
🎨 Visualization and Interpretation
🪞 Mirrored Indicator View
Setting up a mirrored view of the Future Pivots indicator can significantly aid in interpretation by providing a symmetrical visualization of potential pivot points. This setup helps avoid directional bias and focuses on identifying significant market movements.
Step 1) Make a copy of Future Pivots by (command copy or control C and then command V) and then drag and drop it on top of the existing Future Pivots Indicator. It should look like the screenshot below.
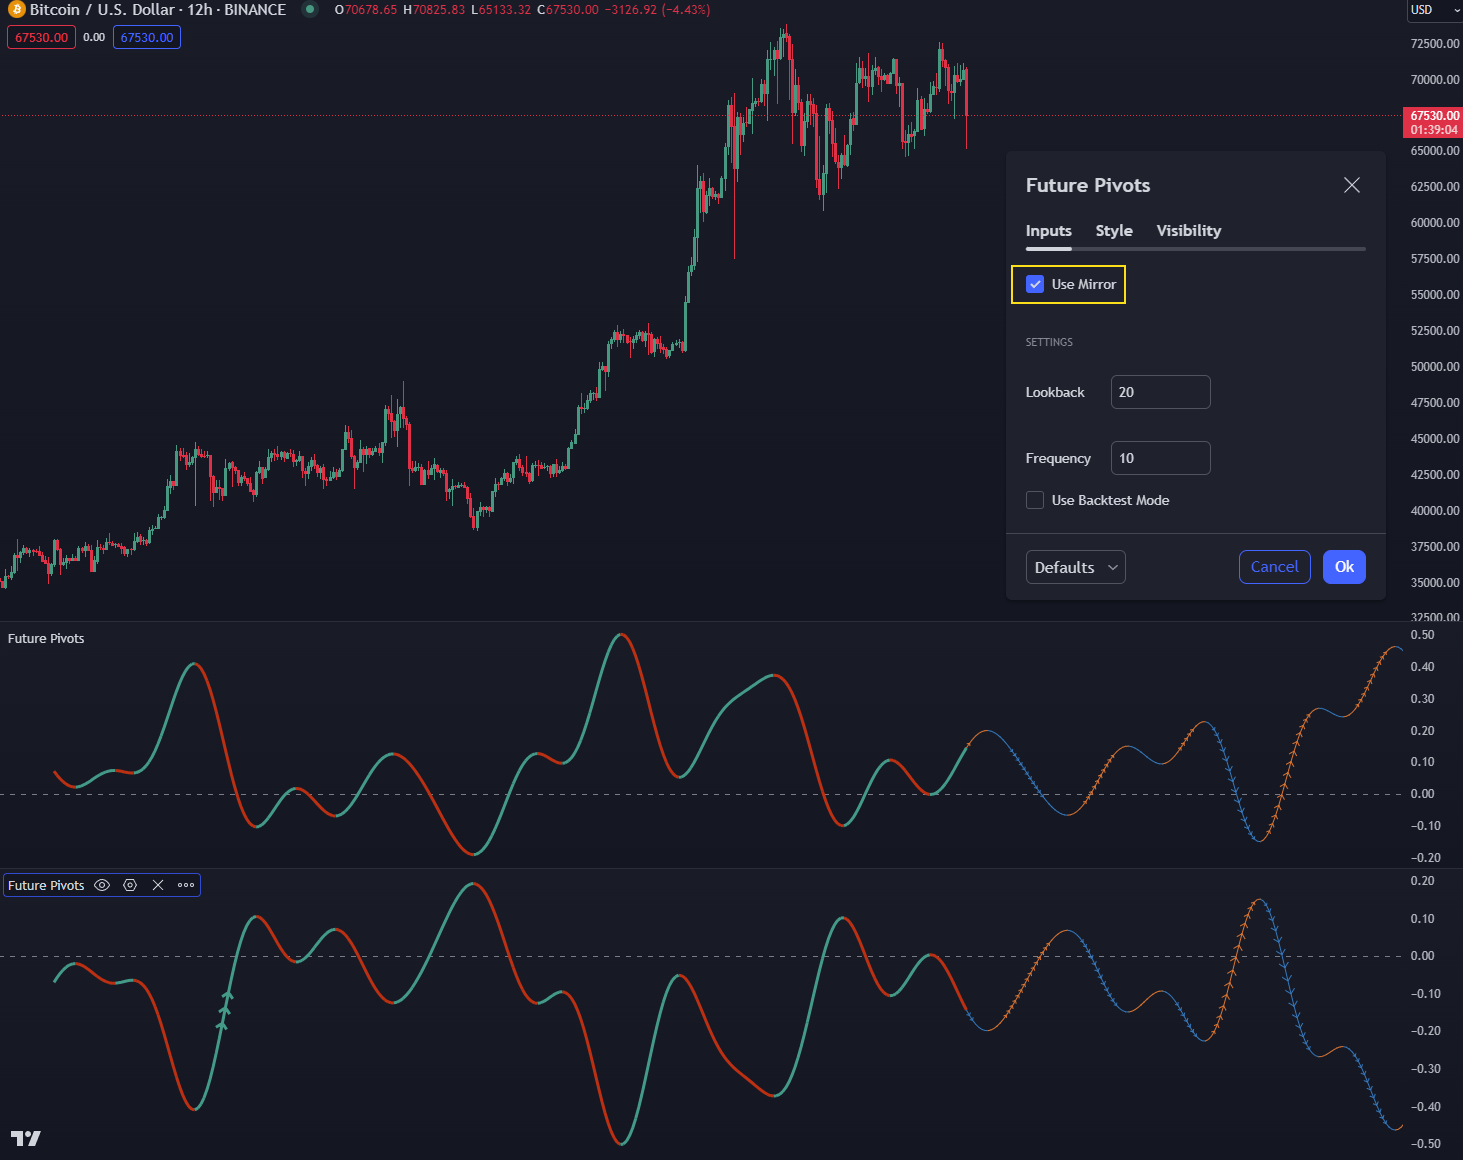
Step 2) Mirror one of the copies by going into the settings menu for the indicator and selecting "Use Mirror".
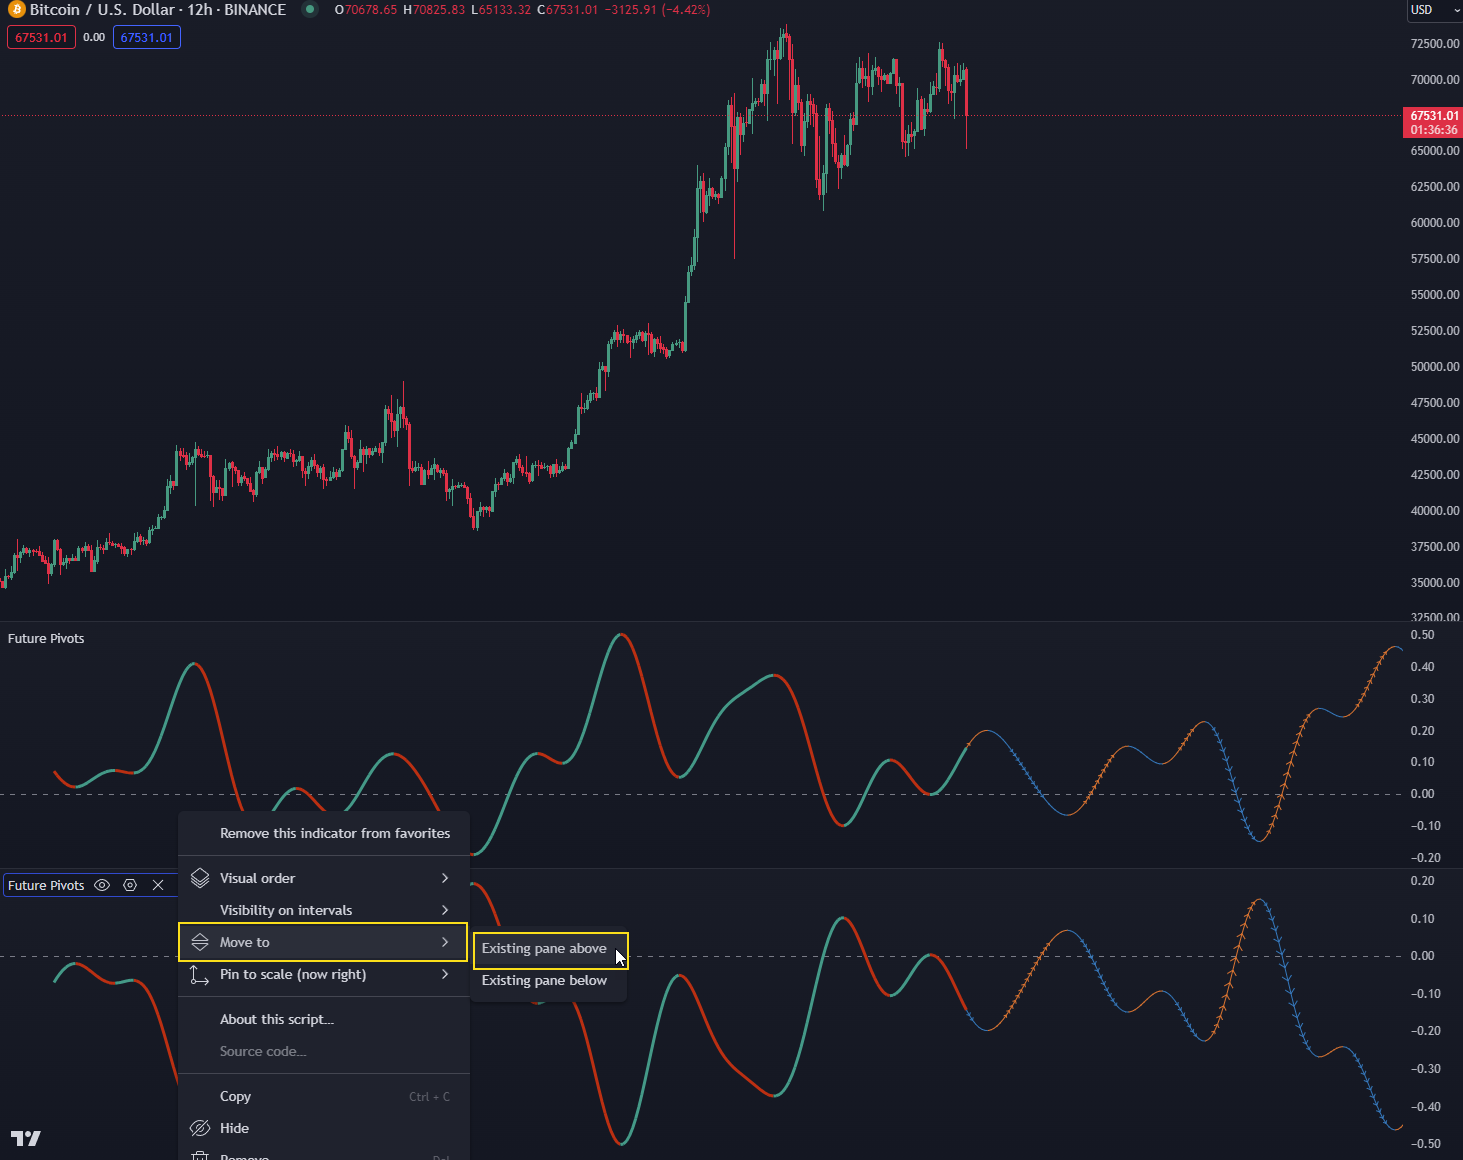
Step 3) Merge the two Future Pivots indicators by clicking the ellipses on one of the Future Pivots indicator and then Move to and either Existing pane above or Existing pane below based on your layout.
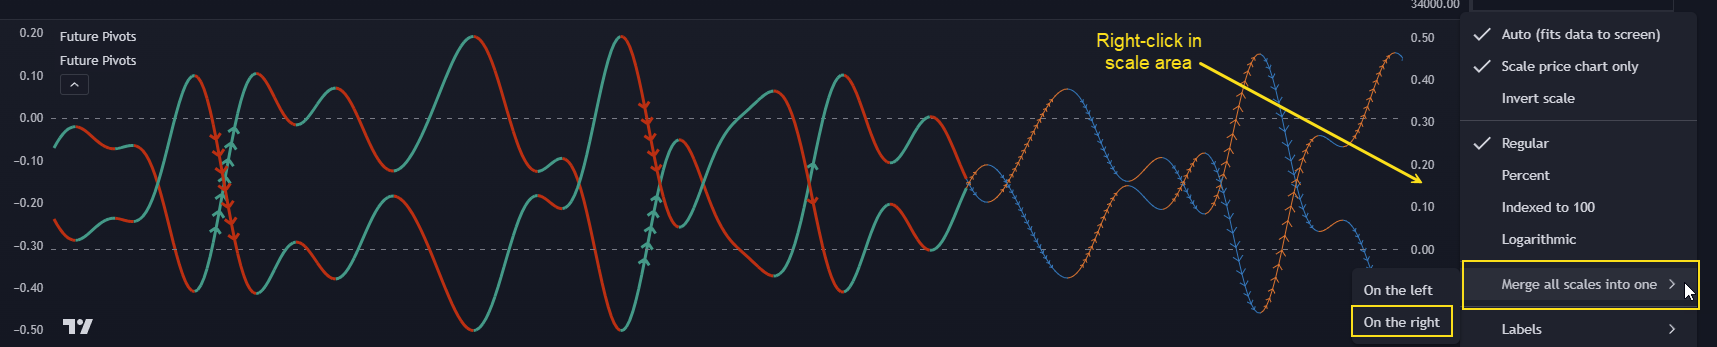
Step 4) Finally, merge the scales into one on the right-hand side.
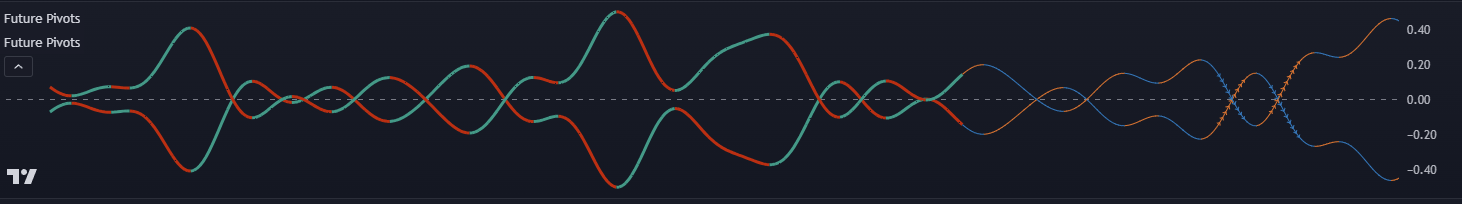
If you successfully followed all the above steps you will have a very powerful mirrored indicator (as below). This is nice because you don't get hung up on where the price action is going, bullish or bearish because it's very easy to get confused.
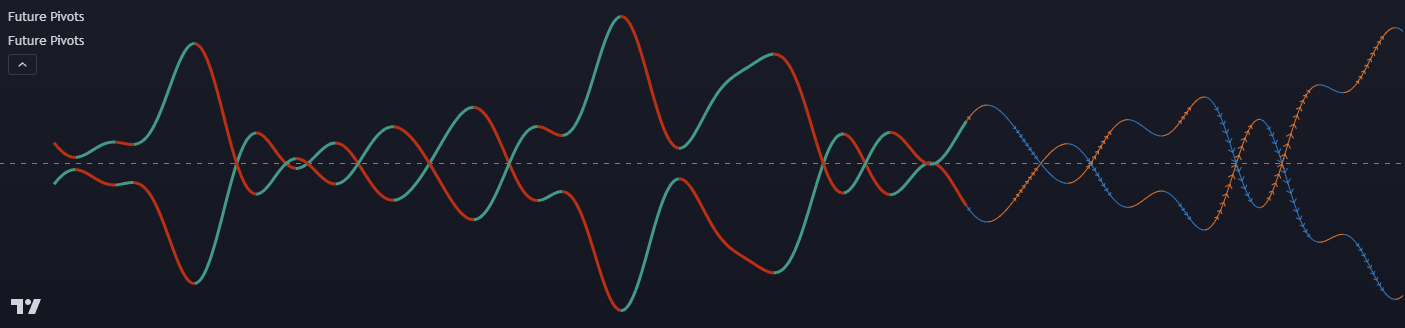
Sometimes you'll notice that it actually crosses over the median and stays tightly coiled. Anytime you have a self cross you will want to make note of it as it often can be fairly significant.
🤝 Integration with Other Indicators
- Lorentzian Classification Compatibility: It's important to note that FP cannot directly feed into Lorentzian Classification due to technical differences. However, both can be used in tandem on a chart to enhance analysis.